Dashboard Overview
The Dashboard provides a quick overview of your Vector Data Loader activity and serves as your central navigation hub.
Navigation Sidebar
The left sidebar contains the main navigation:
| Item | Description |
|---|---|
| Project Selector | Switch between your projects using the dropdown (top) |
| Dashboard | Return to this overview page |
| Sources | Manage your connected data sources |
| Documents | View and manage synced documents |
| Playground | Test semantic search and RAG chat against your indexed documents |
| Usage | Monitor your usage statistics and quotas |
| Settings | Configure vector stores, embeddings, LLM models, and more |
| Credit Balance | Shows your current credit balance (above profile) |
| User Menu | Access profile, organization, billing, documentation, and sign out (bottom) |
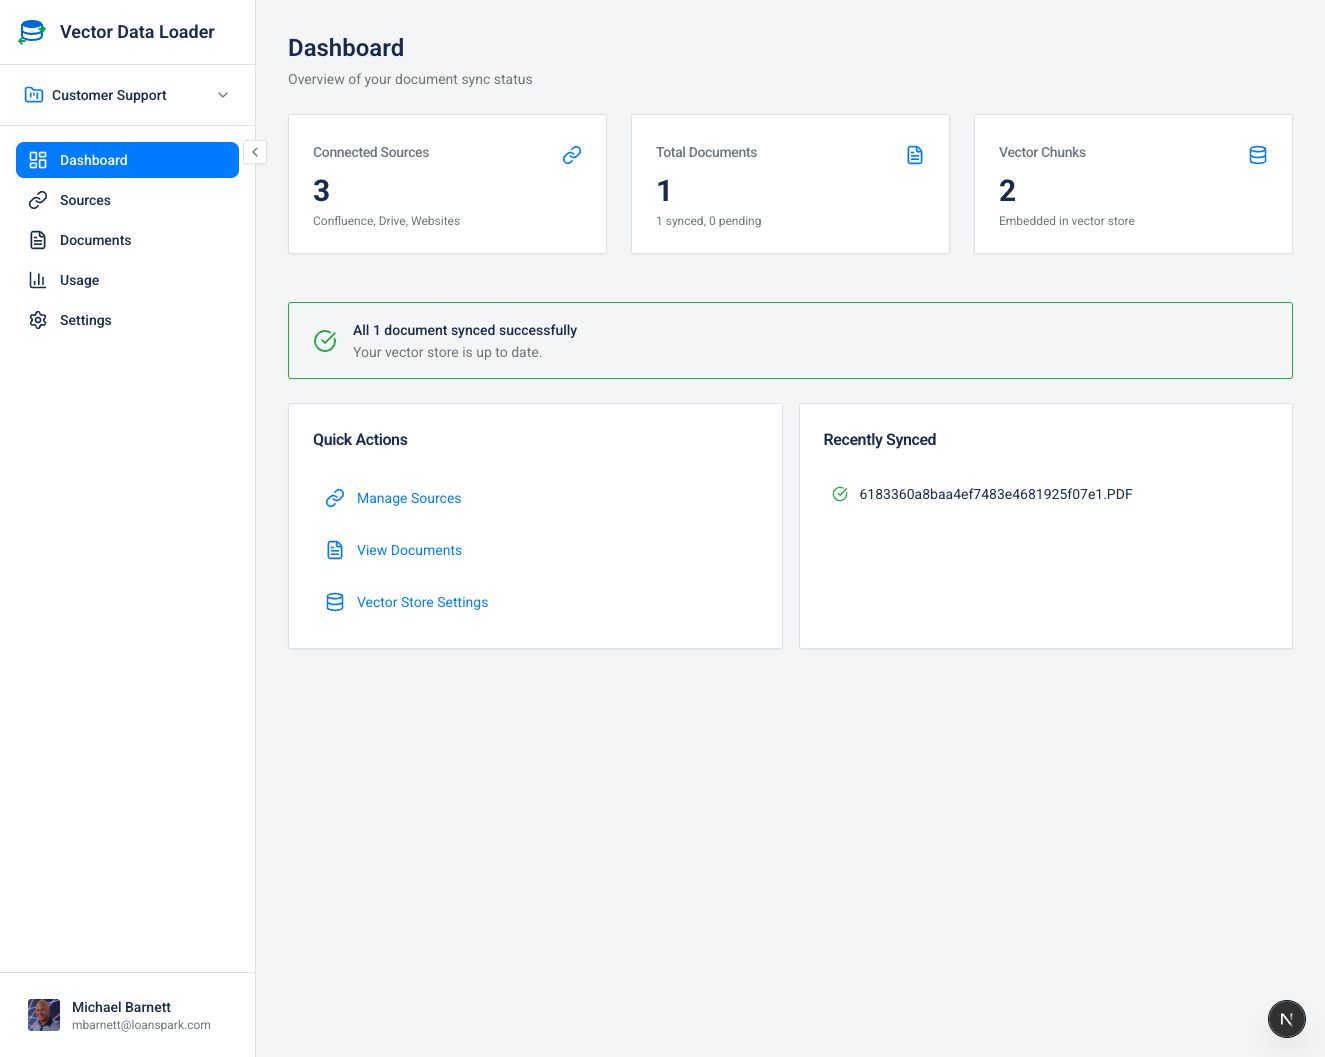
Statistics Cards
The main dashboard displays key metrics:
| Metric | Description |
|---|---|
| Connected Sources | Number of active data source connections |
| Total Documents | Count of documents synced to your current project |
| Vector Chunks | Total number of vector embeddings created from your documents |
These statistics are scoped to your currently selected project, helping you track progress on a per-project basis.
User Menu
Click your profile avatar at the bottom of the sidebar to access the user menu:
| Option | Description |
|---|---|
| Profile | Update your display name, avatar, and job title |
| Organization | Manage organization details, team members, and close account |
| Billing | View credits, purchase packages, view transaction history |
| Settings | Jump to the main settings page |
| Documentation | Opens this documentation site in a new tab |
| Sign out | Log out of your account |
Need help? Click your profile avatar and select Documentation for instant access to guides, tutorials, and reference material.
Sync Health Panel
The Sync Health panel provides visibility into your sync reliability over the last 7 days.
| Metric | Description |
|---|---|
| Job Outcomes | Badges showing succeeded (green), partial success (yellow), and failed (red) job counts |
| Document Success Rate | Percentage of individual documents that synced successfully |
| Average Duration | Typical time for sync jobs to complete |
| Errors by Source | Which source connectors are experiencing failures |
| Top Errors | Most frequent error messages to help diagnose recurring issues |
If no sync jobs have run in the past 7 days, the panel shows an empty state message.
The Sync Health panel helps you spot patterns — for example, if Google Drive syncs are failing frequently, you may need to reconnect the source or check your OAuth credentials. See Sync Reliability & Recovery for details on how the retry system works.